GSF and NE

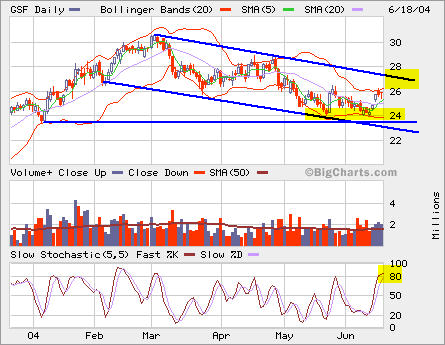
Since GSF hit the 52 week high of 30.69, it has been steadily declining. The current bounce is still within the channel lines. Will it break out? Not sure. It’s a short candidate when reaching the top channel line if overall market is not in a big swing up.

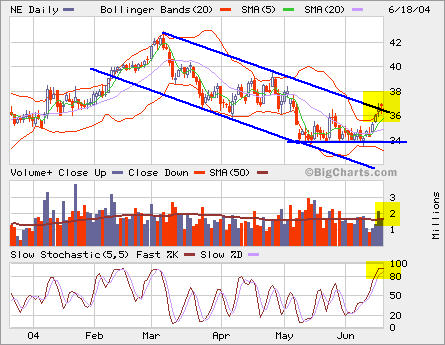
Looking at NE, it’s right at the top channel line, it’s over bought, but it has an increasing volume while going up. Let’s wait for a while to see if it breaks out or down.

QQQ

QQQ bounced back from the support at 34. The big intraday swing probably caused a lot of pains among many. It needs to take out 35.5 to show the strength of the bulls.

QQQ

QQQ bounced back from the support at 34. The big intraday swing probably caused a lot of pains among many. It needs to take out 35.5 to show the strength of the bulls.

ES

1 point tonight. Two shorts: 1046.75 and 1046.5. Covered them at 1046.25 and 1046. The stop was set at 1048.5 way above recent high 1047.

It’s been profitable on ES front although scalping is just picking the pennies. I may venture into swing trade over a few days or a week horizon. What would be the target and stop for swing trade? I guess I would risk no more than 1-2% of the capital on each trade. The setups will be two: trend following using SMA 5 and 20, and Bollinger Bands/Slow Stochastic. I’m using the same setup trading other stocks and options.

Bot SUNW Jan04 at 4.05, rolling over Nov contracts to Jan.

Other than a long position on SUNW, almost 100% is in cash right now.

Which pond are you in?

Here’s an interesting article. Here I copied portion of it. We can figure out which pond we are in.

NAME POND HOLDING PERIOD FOOD SOURCE QUALITIES
Investors Random No clue No Clue No Clue
Mutual Funds Daily Weeks Investors Huge amounts of money, Marketing/research groups, and a tackle box full of Investrador lures.
Swing Traders Daily Days Investors Smart, careful. Decision-making after market hours.
Institutions 15 Minute Hours Mutual Funds Deep pockets, Move Markets over short timeframes, very astute, inside information.
Day Traders 5 Minute Minutes 15 Minute Fish Waits for rock solid plays. Decisive. Decision making during market hours.
Momentum 2 Minute Seconds Investradors Timing High Volume, High Volatility Stocks.
Scalpers 2 Minute Seconds Everyone Happy just going click, click, click all day long.

Basically, you are taking money from the timeframe above you and giving money to the timeframe below you. For example, if you measure your holding period by minutes, then trade off a 5 minute chart. However, you need to monitor the 15 minute and daily charts for opportunities. Likewise, use the 2 minute chart to monitor that pond for hazards. But remember if you are playing in the 5 minute pond then stay there. Don’t move from pond to pond.