Here’s an interesting article. Here I copied portion of it. We can figure out which pond we are in.
| NAME |
POND |
HOLDING PERIOD |
FOOD SOURCE |
QUALITIES |
| Investors |
Random |
No clue |
No Clue |
No Clue |
| Mutual Funds |
Daily |
Weeks |
Investors |
Huge amounts of money, Marketing/research groups, and a tackle box full of Investrador lures. |
| Swing Traders |
Daily |
Days |
Investors |
Smart, careful. Decision-making after market hours. |
| Institutions |
15 Minute |
Hours |
Mutual Funds |
Deep pockets, Move Markets over short timeframes, very astute, inside information. |
| Day Traders |
5 Minute |
Minutes |
15 Minute Fish |
Waits for rock solid plays. Decisive. Decision making during market hours. |
| Momentum |
2 Minute |
Seconds |
Investradors |
Timing High Volume, High Volatility Stocks. |
| Scalpers |
2 Minute |
Seconds |
Everyone |
Happy just going click, click, click all day long. |
Basically, you are taking money from the timeframe above you and giving money to the timeframe below you. For example, if you measure your holding period by minutes, then trade off a 5 minute chart. However, you need to monitor the 15 minute and daily charts for opportunities. Likewise, use the 2 minute chart to monitor that pond for hazards. But remember if you are playing in the 5 minute pond then stay there. Don’t move from pond to pond.
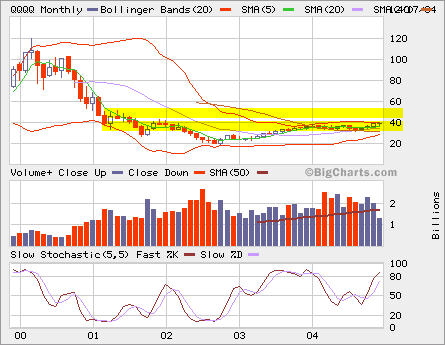
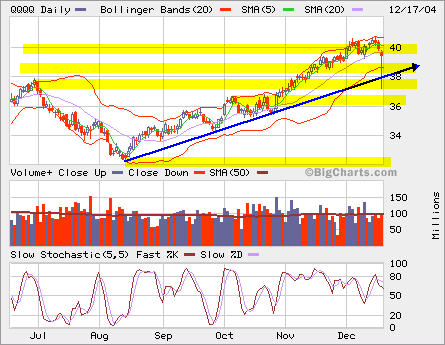 QQQQ had a little pullback. It did break SMA 20. After almost 5 month of steady move, it may just go sideway for a while as it did around 36 in October. The major support should be at 38. Take a look at the weekly and monthly charts for more perspectives.
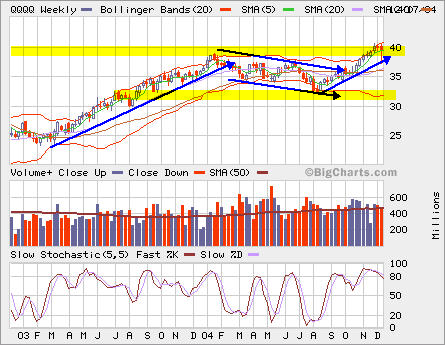
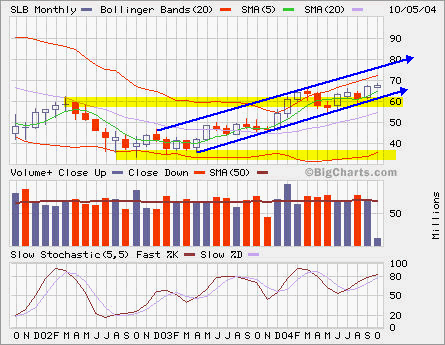 SLB has been in this uptrend for more than a year. At oil price above $51, it is breaking out from recent consolidation around the resistence at 60.
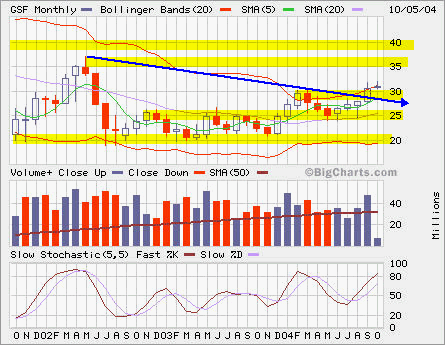 GSF is approaching its resistence at 35 if it can overcome the resistence at 32 first. Based on its charts, we may see another pullback before breaking out at 32.
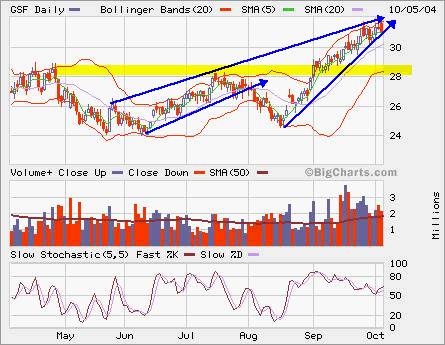
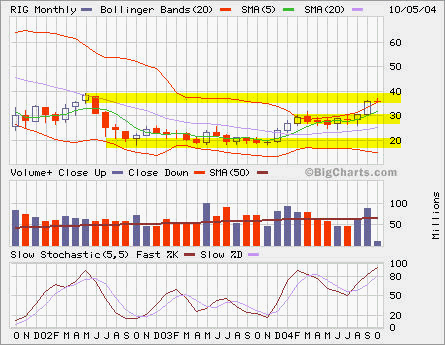 RIG is already half way to its resistence at 40.