All major markets rocket back over 10% today. A lot of short squeezes probably. I don’t believe that there’re so many longs that couldn’t wait and jump on the buying spree.
On the monthly chart of Dow Jones Industrial Average (INDU), you can see that we’re approaching previous low, which occured 5 years ago. Have we reached the bottom yet? Not sure, but we might be near the bottom judging by the previous low, which is the current support level.
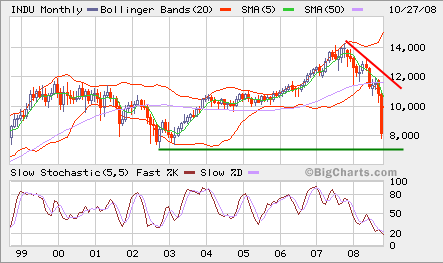
The looming global recession is on everyone’s mind, so it’s possible that the support may not hold. There will be many ups and downs around that support. We can certainly play longs at the support level and shorts at any rally near 9,500/10,000 zone. The markets are currently in oversold condition and volatility will remain high as seen in the past a few weeks.
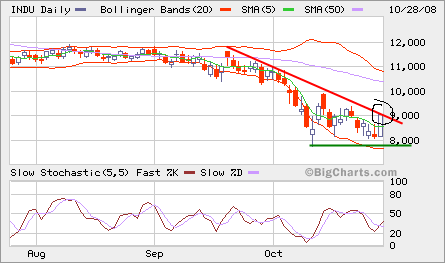
On the 3-month daily chart, INDU is moving away from the oversold condition. If we don’t see a follow through on this snap back, the downward trend will continue. 8,000 looks like a good support for now and the more fight between the bears and bulls around 8,000 the stronger it will become. If the downtrend continues, 7,500 is the next major support to watch.

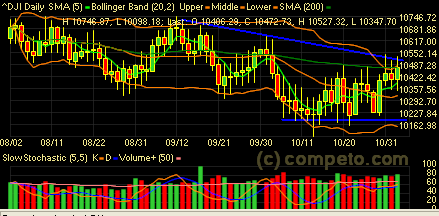 All major indexes are back at the SMA 200 line. Judging from the overhead downtrend lines and SMA 200, we shall see some pullback unless the bulls take charge from here.
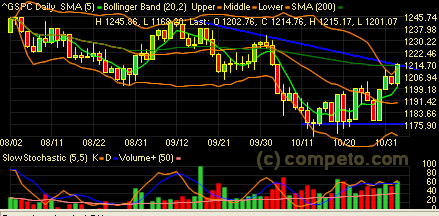
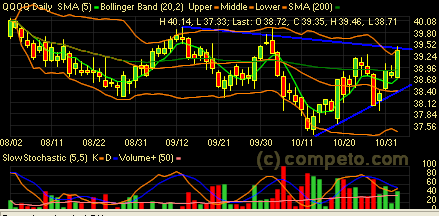
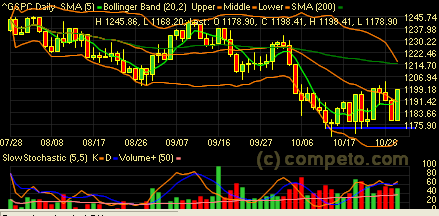
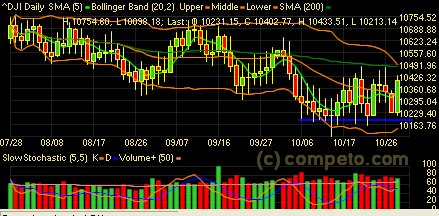 The market acted like a yo-yo. Yesterday Dow Jones Industrial was down 115 and today it’s up 172. The blue lines might be the bottom for the short term. We shall see some upside to test the SMA 200 which acts like the dividing line of bulls and bears.
 The good earning report pushed it to break out this triangle, but the doji and long red candles didn’t look good for the bulls. If it moves below the trend line, it may be a short. Going long from this point does not provide a good risk/reward opportunity as the overhead resistence is very close at 73.27.
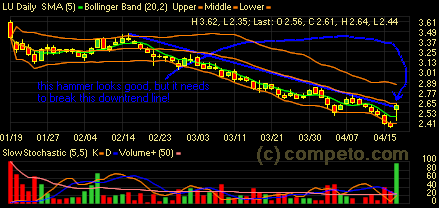 LU must break out from this dreadful downtrend line or this pop would be just another good short! The hammer stopped right below SMA20 too. We shall see soon how the bulls and bears resolve on this one.