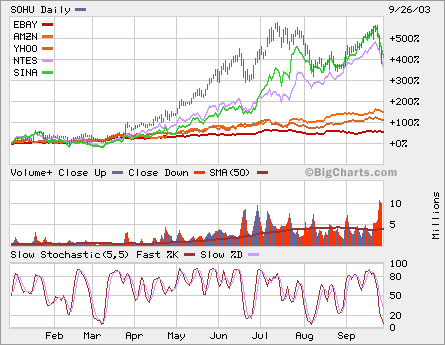
Here’s the YTD chart for some Internet stocks.


Here’s the YTD chart for some Internet stocks.
Here’s an interesting article. Here I copied portion of it. We can figure out which pond we are in.
| NAME | POND | HOLDING PERIOD | FOOD SOURCE | QUALITIES |
| Investors | Random | No clue | No Clue | No Clue |
| Mutual Funds | Daily | Weeks | Investors | Huge amounts of money, Marketing/research groups, and a tackle box full of Investrador lures. |
| Swing Traders | Daily | Days | Investors | Smart, careful. Decision-making after market hours. |
| Institutions | 15 Minute | Hours | Mutual Funds | Deep pockets, Move Markets over short timeframes, very astute, inside information. |
| Day Traders | 5 Minute | Minutes | 15 Minute Fish | Waits for rock solid plays. Decisive. Decision making during market hours. |
| Momentum | 2 Minute | Seconds | Investradors | Timing High Volume, High Volatility Stocks. |
| Scalpers | 2 Minute | Seconds | Everyone | Happy just going click, click, click all day long. |
Basically, you are taking money from the timeframe above you and giving money to the timeframe below you. For example, if you measure your holding period by minutes, then trade off a 5 minute chart. However, you need to monitor the 15 minute and daily charts for opportunities. Likewise, use the 2 minute chart to monitor that pond for hazards. But remember if you are playing in the 5 minute pond then stay there. Don’t move from pond to pond.