
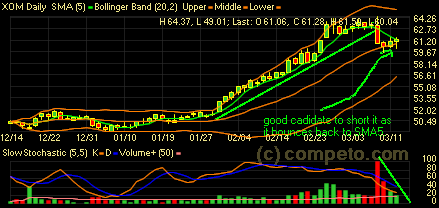
 Like all energy related stocks, XOM is quite extended. This bounce may be a chance to short it. The stop can be placed somewhere above the SMA5.
Tag Archives: Short
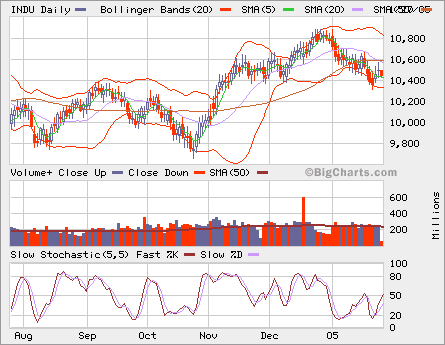
INDU
The short-term moving averages have become the overhead resistences. Both SMA 20 and 50 are pointing downwards currently, a bearish tune in spite of runup in the past two days. The longer-term SMA 200 is the support area and it’s pointing side way.
MSTR to fill the gap?
 It looks like this gap will be filled soon. On the back of my mind, I was thinking about when to short it, but never acted upon. There is more room to go downward. It’s not in over sold condition yet and the selling pressure is huge based on the volume spike. A lot of catching a falling knife things are going on as every sell had to be matched with a buy!
Karen Carpenter
I ordered a Carpenters Gold – 35th Anniversary Edition CD set for my wife as Christmas gift from amazon.com. Both of us love Karen Carpenter’s songs very much. I first heard her songs on cassette in 1983 the year she died (Feb 4, 1983). There was no Internet then, we had limited access to the world, mostly through short-wave radio or some printed media. So I knew very little about herself other than her crystal clear, amazingly beautiful voice, and wonderful melodies.
To get free shipping, I ordered another CD for myself,
Yo-Yo Ma’s Sinfonia Concertante/Tchiakovsky: Variations on a Rococo Theme/Andante Cantabile.
MSFT
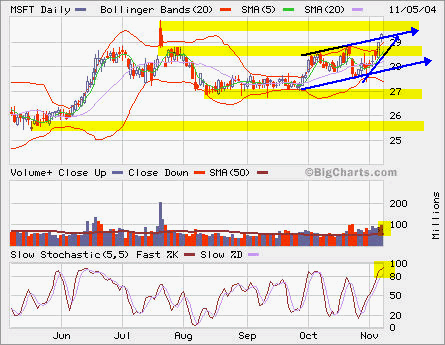 MSFT is moving towards major resistence at 30 once again. The volume is picking up and it’s in overbought condition. Later this month, it will pay a special dividend of $3. The stock price, its SSF and options will be adjusted with the $3 change accordingly.
If you like to play breakout, you may watch it closly if it breaks out from 30 with higher than average volume, which is about 50 million shares.
If you like to short, it’s pretty close to the top now. The next resistence above 30 is 32, but you may not want to have that big stop loss. So it’s somewhere between 30 and 32.
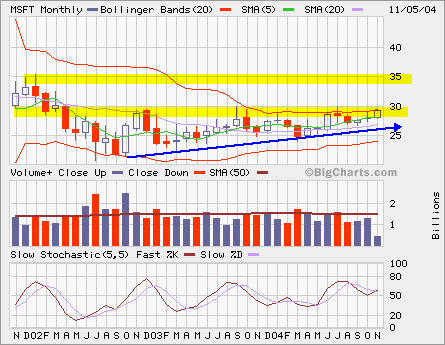 The monthly chart shows an ascending triangle indicating a possible breakout from 30. You may buy straddle (buy a call and a put at the same strike and expiration date) to capture this breakout, but with recent sharp move, you may have to pay more since its volativity is higher.