
The connectivity to this site was lost on May 27 and restored today. The ISP’s service is really bad. They sent many crews trying to fix the problem, but none was responsible for making sure the probelm was fixed. I ended up managing it for them! I called their support center to make sure each work order was completed and new work order was created until the problem was finally resolved. One significant factor for such long delay is that they create a new ticket whenever a call to the support center is made, therefore, it’s subject to waiting in the queues.
Tag Archives: Call
YHOO breaking out?
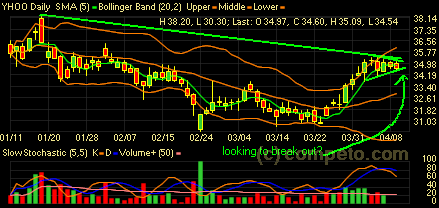 YHOO is forming a triangle here. If the triangle is resolved from the short-term trend, which is up, the breakout should be on the upside; if it’s resolved from the intermediate-term, it will go down. I will try to see if a long on a slight OTM calls for May or June would work. A May 37.5 Call is currently sold at 0.60.
GOOG downgraded
![]() GOOG was downgraded. It dropped 10 point intraday. It’s again sitting right at the upend trend line. I have opened a position on GOOG Apr 200 Call at 5.6. Apr 200 Call closed at 6.1. The white candle looks good after the hugh gap down this morning. What I read from it is that there’re a lot of buying at this level despite the big drop.
GOOG was downgraded. It dropped 10 point intraday. It’s again sitting right at the upend trend line. I have opened a position on GOOG Apr 200 Call at 5.6. Apr 200 Call closed at 6.1. The white candle looks good after the hugh gap down this morning. What I read from it is that there’re a lot of buying at this level despite the big drop.
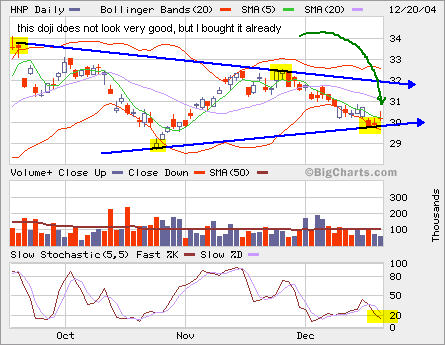
HNP
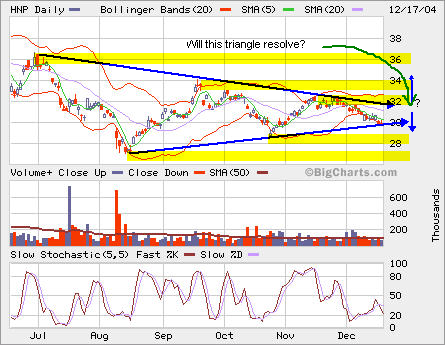 HNP is forming a triangle here. Which direction will it resolve to? The prevailing trend is down, but it’s been in oversold condition for a month, so I think it will move up from here. How far can it go? I’m not sure. The resistences are at 32 and 34. I may open a small call position on HNP Jan or Feb 30 Calls. Yesterday, the quote for Feb 30 Call was 1.3 x 1.5.
Updated:
MSFT
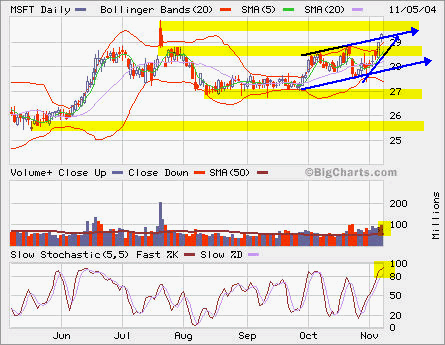 MSFT is moving towards major resistence at 30 once again. The volume is picking up and it’s in overbought condition. Later this month, it will pay a special dividend of $3. The stock price, its SSF and options will be adjusted with the $3 change accordingly.
If you like to play breakout, you may watch it closly if it breaks out from 30 with higher than average volume, which is about 50 million shares.
If you like to short, it’s pretty close to the top now. The next resistence above 30 is 32, but you may not want to have that big stop loss. So it’s somewhere between 30 and 32.
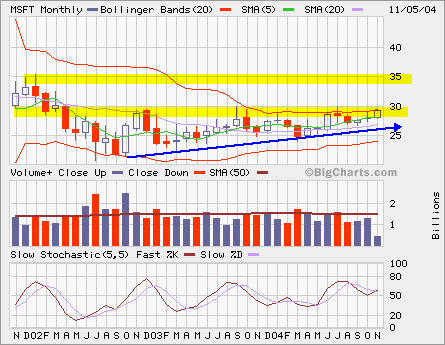 The monthly chart shows an ascending triangle indicating a possible breakout from 30. You may buy straddle (buy a call and a put at the same strike and expiration date) to capture this breakout, but with recent sharp move, you may have to pay more since its volativity is higher.