
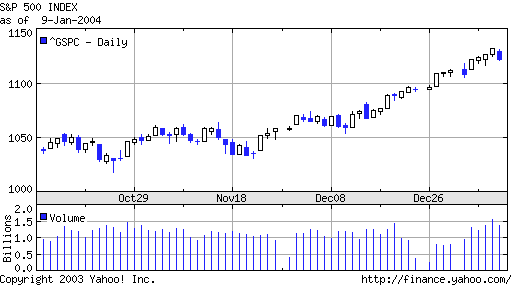
The blue candle showed on Friday when the job market report didn’t make the grade. The sell-off occured in the first a few minutes and last hour. Before the last hour plunge, it actually recovered most of the loss.
The volume (judging from SPY chart) was more than 50% higher than average.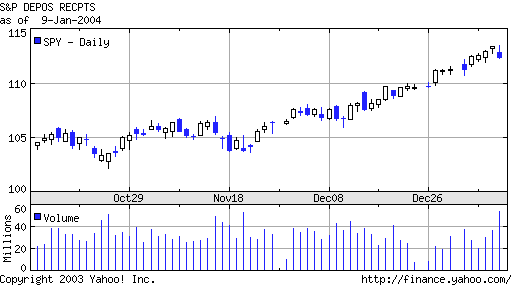
 It was rumored that a big firm sold a lots of puts to their customers and had to sell ES to hedge their position, thus the big plunge in the last hour.
Since the uptrend line is still intact, Monday’s open shall give us some indication of where the market will go. Currently, it’s pretty extended. It would make sense if it goes sideway for a few days or a week to ease up the over bought condition. I would not be a buyer at this time. I will look for weakness to short it.