
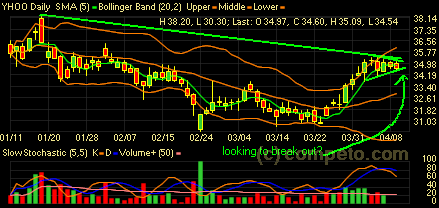
 YHOO is forming a triangle here. If the triangle is resolved from the short-term trend, which is up, the breakout should be on the upside; if it’s resolved from the intermediate-term, it will go down. I will try to see if a long on a slight OTM calls for May or June would work. A May 37.5 Call is currently sold at 0.60.
Tag Archives: Trend
Free Charting Software
Stablevalue.com will now use a new charting software, Trader.NET Charting, to provide technical analysis. It’s free! The program supports candlestick chart, technical indicators and custom indicators if you know how to program. It allows you to add comments and trend lines in a chart, and export the chart to a file for publishing or sharing.
GOOG downgraded
![]() GOOG was downgraded. It dropped 10 point intraday. It’s again sitting right at the upend trend line. I have opened a position on GOOG Apr 200 Call at 5.6. Apr 200 Call closed at 6.1. The white candle looks good after the hugh gap down this morning. What I read from it is that there’re a lot of buying at this level despite the big drop.
GOOG was downgraded. It dropped 10 point intraday. It’s again sitting right at the upend trend line. I have opened a position on GOOG Apr 200 Call at 5.6. Apr 200 Call closed at 6.1. The white candle looks good after the hugh gap down this morning. What I read from it is that there’re a lot of buying at this level despite the big drop.
Market Overview
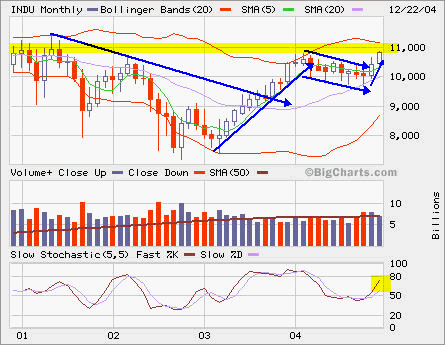 INDU is approaching its major resistence at 11,000. We may hit 11,000 before 2004 ends even we will only have one trading seesion left on the calendar!
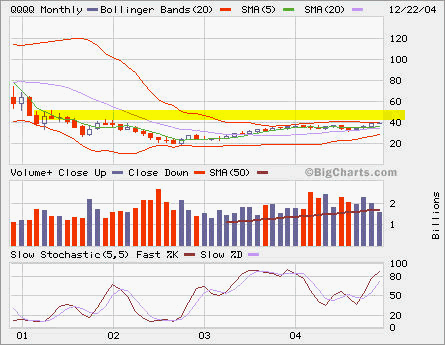 QQQQ has been around 40 a few times, it poses to break through the resistence and leaves this long base built over three years!
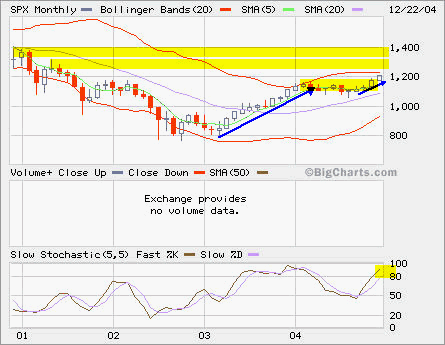 SPX looks more like INDU than QQQQ, but its major resistence is at 13,00 before next one at 1,400, still a long way to go. The trend is up.