MSFT

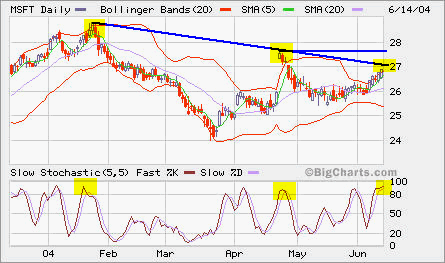
MSFT closed up at 27.77. The intraday high was 27.92 with more than 100M shares changing hands.

It should attempt 28 pretty quick. The resistence is at 28.7 and support is at 26.8. I would not chase it at this moment. You may be able to wait for a pullback to go long around 27.

MSFT

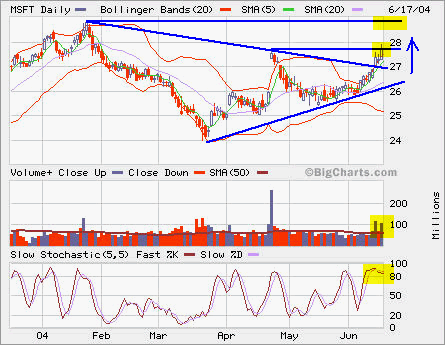
MSFT closed at 27.41 with heavy volume. It barely broke out the resistence, but the long candle looks less bullish. Obviously, a lot of people are selling into the pop and the buying demand could not hold up in the close. If tomorrow it has a follow up, it will be very bullish.

You can go long at the breakout or wait for the handle in a typical cup-and-handle case, but the pullback may not happen if it is very strong breakout.

LOW and MSFT

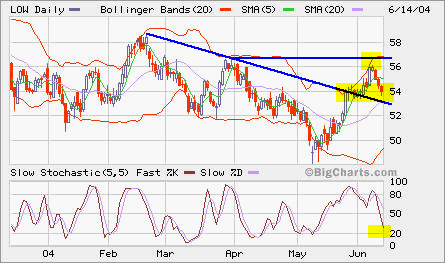
As expected in the last entry, LOW clsoed at 54.01. The intraday low was 53.68. However, the volumne was low. I closed my Jul 55 Put position at 2.00 opened a few days ago.

MSFT has been moving up a little bit in spite of declining overall market. If it breaks out from 27.5, it will signal a new attempt of bullish trend since it hit the bottom in March.

MSFT

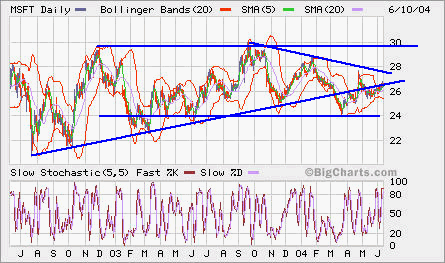
MSFT broke down a little bit from the two year uptrend line in March as seen in this weekly chart. It’s slowly forming a cup. Whether or not it can break out from the intermediate term downtrend remains to be seen in the comming weeks. MSFT has been lagging from its peers. However, with its over $50B in cash and gradually settled legal cases, plus M&A rumors such as SAP, we may see some big movement sson.