
 Here’s a new GUI design I have come up for order entry management. In addition to a DOM price grid where one can click to generate a buy or sell bracket order with target and stop loss, a canvas is provided to manage orders.
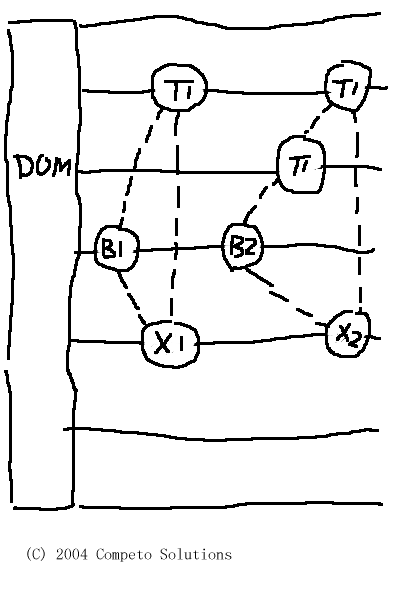
The generated backet orders are represented in a canvas where all price levels are drawn in horizontal grids much like the ones in a chart. Each order such as entry, target and stop loss is reprresented by a circle or rectangle. These three or more circles or rectangles are linked with either dotted or solid lines to form a trade group. One can drag and drop or move the circles or rectangles around and they can anchor at any price grid lines. If one likes to scale in, more target circles or rectangles will be formed in the trade group. If an order is filled, it will be fixed at the filled price grid line vertically, but one can still move it horizontally.
As illustrated in the diagram, if ES is traded, the first trade has a Buy 1 ES (B1) with a target Sell 1 ES (T1) and stop loss Sell 1 ES (X1). The second trade has a Buy 2 ES (B2) and two targets Sell 1 (T1 and T1) and stop loss Sell 2 (X2). One can form multiple trade groups, each with different set of strategy that manages the targets and stop loss. The canvas provides a nearly free-form order entry management interface to any trading platform. In a way, it looks like a chess board!