Short Term Bond Fund VFSTX

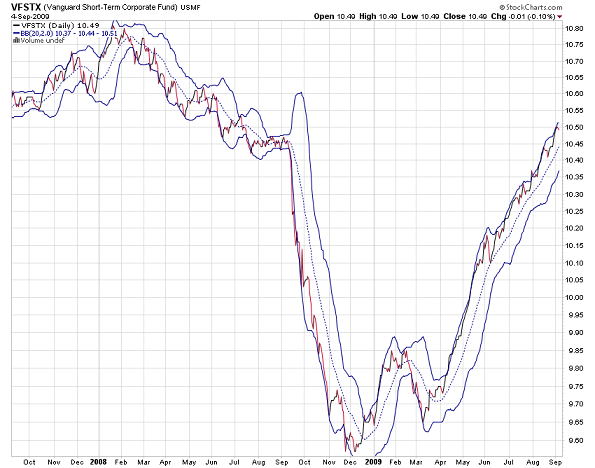
Here we took a look at one of Vanguard Bond Funds: VFSTX. Yield 4.41%; YTD return 10%; investment grade corporate bonds; average maturity 2.6 yr.

It suffered a 10% drop in price in 2008. The actual return was -5%, which was big in short term investment grade bond fund.

What was the cause of that big drop? Client redemption? Maybe considering credit crisis occurred last year. A few bond holdings went under? Maybe too. Had it owned Lehman Brother, for example.

It’s quite interesting that it has a unusual V-shape recovery after the drop. Obviously the relative higher yield has been attracting a lot of investors looking for better returns on their short term investment. Has it also attracted a lot of people who are basically using it as money market funds? Maybe.

Another reason for the recovery might be the valuation of its certain holdings has recovered since the credit crisis.

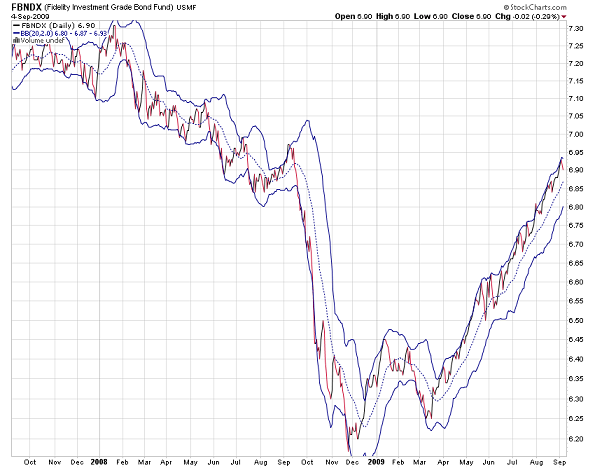
For comparison, here’s Fidelity FBNDX chart, which showed similar drop last year.

If you have owned similar fund, you probably want to pay closer attention to its price movement.
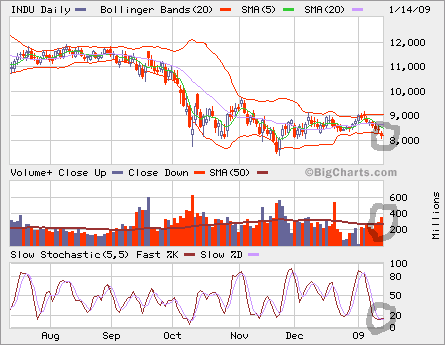
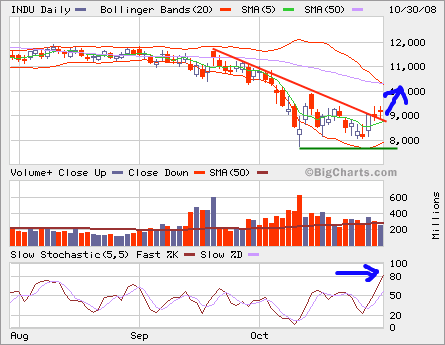
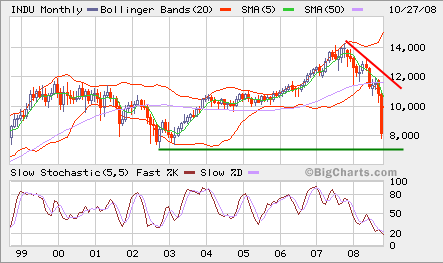
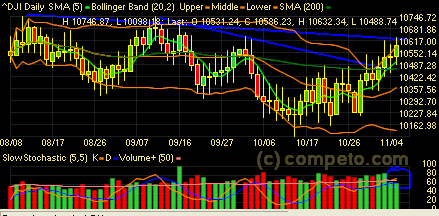
Dow Jones Industrial Average Is Walking Out Its Downtrend

It closed up today and the week so it’s following through the big shoot up the other day. As we can see that on the daily chart, it’s in short-term over bought condition now. It’s slowly walking out the downtrend line, but we should be cautious as the volume was not confirming.

If you have significant equity positions in your portfolio, any rally into 9,500-10,000 zone can be your opportunity to lighten up and preserve your capital during this bear market.

Market Rockets Back

All major markets rocket back over 10% today. A lot of short squeezes probably. I don’t believe that there’re so many longs that couldn’t wait and jump on the buying spree.

On the monthly chart of Dow Jones Industrial Average (INDU), you can see that we’re approaching previous low, which occured 5 years ago. Have we reached the bottom yet? Not sure, but we might be near the bottom judging by the previous low, which is the current support level.

The looming global recession is on everyone’s mind, so it’s possible that the support may not hold. There will be many ups and downs around that support. We can certainly play longs at the support level and shorts at any rally near 9,500/10,000 zone. The markets are currently in oversold condition and volatility will remain high as seen in the past a few weeks.

On the 3-month daily chart, INDU is moving away from the oversold condition. If we don’t see a follow through on this snap back, the downward trend will continue. 8,000 looks like a good support for now and the more fight between the bears and bulls around 8,000 the stronger it will become. If the downtrend continues, 7,500 is the next major support to watch.